Ever since I started coding music I have been exploring tools to help visualize it! So right now for all the visuals in my live coding content, I primarily depend on hydra! It’s a live code-able video synth and coding environment running directly in the browser so super easy and straightforward to plug in & overlay to record with OBS!
There is also Processing which is the OG creative coding language built on Java and p5.js built on JavaScript using some established models that Processing has introduced. Processing comes with a bit of an overload i.e it’s own editor & IDE while p5.js is basically a reinterpretation of Processing for the web, so much like Hydra it’s easier to get started with.
Cool! Now that we know the tools, let’s peek into the process: To make audio reactive visuals means to visualize audio and in-order to do that it would be really nice if we were able to convert our continuous audio signal into something discrete while keeping information about the frequency, amplitude and phase of the sample.
I wonder if there was an easy way to do this?

Fast Fourier Transform
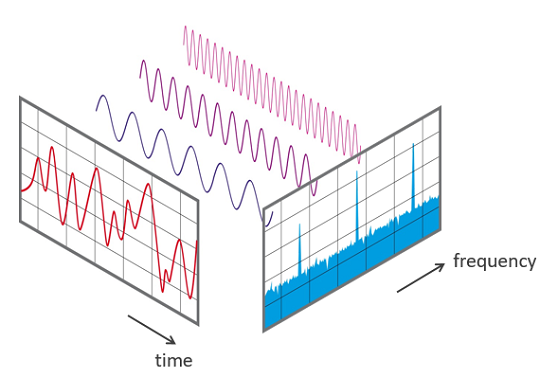
Fast Fourier Transform (FFT) converts a signal from its original time domain into a frequency domain i.e decomposing the signal into its constituent frequencies, revealing the amplitude and phase of each frequency component.
FFT is an optimized algorithm for the implementation of the “Discrete Fourier Transformation”

FFT belongs to my “Algorithms so good they make me cry” list, not only is it versatile, having usecases in identifying musical notes, chords, and rhythms by analyzing the frequency spectrum of a musical piece i,e Sound classification, it’s also used in Speech Recognition, Audio Fingerprinting, Speech Recognition and so much more, ooh and FFT also has a really cool origin story that could have ended the nuclear arms race!!
One of the best videos on Fourier Transform on the internet is from 3Blue1Brown.
Fourier Transform helps decompose a function of time (a signal) into its constituent frequencies, while discrete Fourier Transform is a type of Fourier transform that applies this to a discrete time-domain signal but while processing sequences it stores intermediate results,making it slower and requiring more memory.
FFT divides our discrete signal into smaller ones and performs DFT of these smaller signals recursively! While the DFT requires O(N²) operations to compute, the FFT reduces this complexity to O(NlogN) by cleverly factoring and reusing results of smaller DFTs. The Cooley-Tukey algorithm, a common FFT algorithm, for instance, recursively divides the DFT into two smaller DFTs of even and odd indices.
FFT (Fast Fourier Transform) optimizes on DFT and makes it feasible to process even in real-time applications! which is exactly what we need to start making Audio reactive visuals :)
The frame size in FFT refers to the number of signal samples used in each FFT operation, crucial for analyzing time-varying signals. The frequency resolution can be increased changing the FFT size, that is, the number of bins of the analysis window.
A larger FFT size provides better frequency resolution, allowing for more precise identification of frequencies present in the audio signal. This is because the frequency bins (intervals) are smaller when more data points are analyzed and conversely, a larger FFT size can reduce time resolution since it takes longer to compute each FFT, meaning that changes in the audio signal may not be captured as quickly.
So the choice of FFT size really depends on the application, a smaller FFT size is much more suitable for real-time effects while a larger size might be better for detailed spectral analysis which is not what are wanna do right now.
Time to use FFT to make some cool fkin visuals!!
Hydra:
In Hydra, our Audio object can be accessed via a and using meyda, an audio feature extraction library we can show what hydra is listening to by showing the fft bins using a.show()
Now we can use the bins to control variables, like the color offset
// leftmost (lowest frequency) bin controls `color offset`
osc(10, 0, () => a.fft[0])
  .out()
The fft[] will return a value between 0 and 1, where 0 represents the cutoff and 1 corresponds to the maximum. We could also set the smoothness i.e audio reactivity between 0 and 1 where 0 corresponds to no smoothing (more jumpy, faster reaction time), so 1 means that the value will never change.
a.setSmooth(.8)
Code gist:
P5.js
p5.sound module brings the Processing approach to Web Audio as an addon for p5.js. It provides p5.FFT object to analyze the frequency spectrum and waveform of sounds.
Syntax: p5.FFT([fftSize]) where fftSize: Must be a power of two between 16 and 1024
The object can return two types of data in arrays via two different functions: waveform() and analyze()
- waveform(): Returns an array of amplitude values (between -1.0 and 1.0) along the time domain (a sample of time)
- analyze(): Returns an array of amplitude values (between 0 and 255) across the frequency spectrum.
p5.FFT object can be created in setup() function, then used inside of draw() to continuously update the data to reflect the audio of the given frame.
Processing
Minim is a Java audio library, designed to be used with Processing! We can use minim to run FFT on our audio file and once we have the frequency bands use similar approaches to visualize the signal.
FFT fft;
// create an FFT object
fft = new FFT(out.bufferSize(), out.sampleRate());

void draw()
{
  background(0);
  stroke(255);

    fft.forward(out.mix); // perform a forward FFT
    for(int i = 0; i < fft.specSize(); i++)
    {
        // draw the line for frequency band i, scaling it by 4 so we can see it a bit better
        line(i, height, i, height - fft.getBand(i)*10);
    }
    fill(128);
}
With Processing we can also use saveFrame(“frame-####.tga”); to capture the output from each call to the draw() and straight up make a video right from the IDE!
An example music visualizer made with Processing
Well, these are just some of the tools and approaches i have been toying with to help with my set! There’s still a lot of possibilities visually to make interesting interactions not just with audio but with also other external inputs like video, movement, different randomization logic that can be integrated to make the visual more engaging, different types of geometric visualizations beyond plain ol waveforms, toying with colors and timbres, the scope is literally endless! There is this really cool blogpost about Synchronizing pong to music with constrained optimization: https://victortao.substack.com/p/song-pong which i think is super neat! & when these visuals are performed alongside audio, they add a whole new layer of engagement to the experience.
-
Previous
Stupid shared mutable states & Distributed Locks -
Next
Doing DJ things with Sonic Pi & MIDI controller
Leave a Comment